
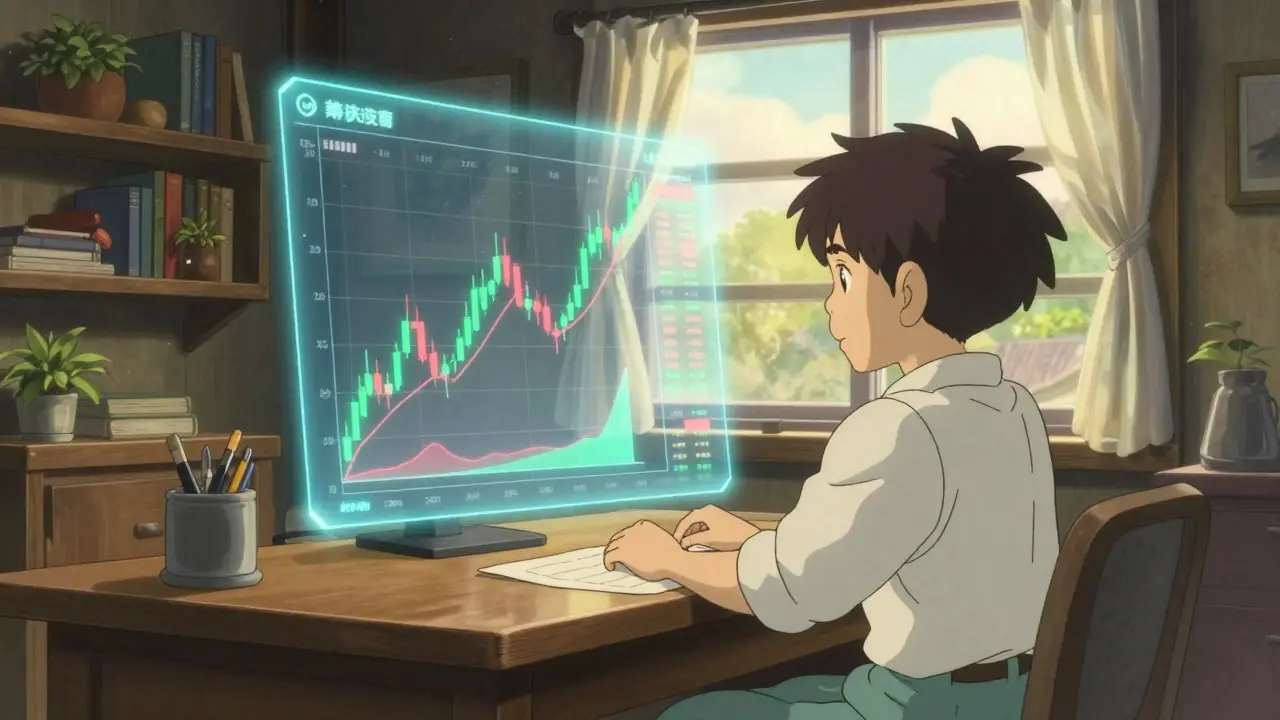
Ever watched a Bitcoin chart spike and wondered how some people seem to know exactly when to jump in? They aren't using crystal balls. They are likely using technical analysis. This method looks at past price movements, volume, and patterns to predict what might happen next. It is the backbone of most active crypto trading strategies.
Unlike fundamental analysis, which asks "is this project good?", technical analysis asks "where is the price going next?" It ignores the technology behind the coin and focuses purely on market psychology and supply/demand dynamics. If you want to trade short-term or time your entries and exits, understanding these tools is non-negotiable.
The Core Assumptions Behind Technical Analysis
To understand why traders use these charts, you need to accept three basic beliefs. First, history tends to repeat itself. Human emotions like fear and greed drive markets, and these emotions create similar patterns over time. Second, prices move in trends. Once a direction is established, it often continues until a major force pushes it back. Third, the current price reflects all known information. If a big news event happens, the price usually adjusts immediately, so you don't need to wait for the news to break; you just watch how the market reacts.
Technical Analysis is a methodology that analyzes historical price data, volume, and market patterns to forecast future price movements and identify optimal entry and exit points. These assumptions work best in volatile markets like crypto, where sentiment swings wildly. However, they can fail during black swan events, such as sudden regulatory bans, where logic takes a backseat to panic.
Essential Tools Every Crypto Trader Needs
You don't need a computer science degree to start. You just need to recognize a few key indicators. Here are the most common ones you will see on any trading platform:
- Moving Averages (MA): These smooth out price data to show the trend direction. The 50-day MA shows medium-term trends, while the 200-day MA indicates long-term health. When the 50-day crosses above the 200-day, it's called a "Golden Cross," often signaling a bull run.
- Relative Strength Index (RSI): This measures momentum on a scale of 0 to 100. Above 70 suggests the asset is "overbought" (might drop), and below 30 suggests it is "oversold" (might bounce).
- Support and Resistance: These are invisible price floors and ceilings. Support is where buyers step in, preventing further drops. Resistance is where sellers take profit, capping gains.
- Bollinger Bands: These bands expand when volatility increases and contract when the market calms down. A squeeze often precedes a massive price move.
Most exchanges like Binance and Coinbase offer these tools for free. Platforms like TradingView provide more advanced options, but the basics are accessible to everyone. The key is not to use all of them at once. Pick one or two that fit your style and master them.

Technical vs. Fundamental Analysis
A common confusion is mixing up technical and fundamental analysis. They serve different purposes. Fundamental analysis looks at the project's whitepaper, team, tokenomics, and real-world utility. It answers the question: "Is this a good investment for the next five years?" Technical analysis ignores those factors entirely. It focuses on price action. It answers: "Should I buy now, or wait for a dip?"
| Feature | Technical Analysis | Fundamental Analysis |
|---|---|---|
| Focus | Price, Volume, Patterns | Project Utility, Team, Tokenomics |
| Timeframe | Short-term (Minutes to Months) | Long-term (Years) |
| Key Question | When to buy/sell? | What to buy? |
| Data Source | Charts, Indicators | Whitepapers, Audits, Adoption Metrics |
| Best For | Active Traders, Day Traders | Long-term Holders, Investors |
In practice, successful traders often blend both. They use fundamental analysis to pick their favorite coins and technical analysis to time their entries. Relying solely on fundamentals might mean buying at the top, while relying solely on techniques might lead you to hold a dying project just because the chart looks pretty.
Common Mistakes Beginners Make
Even with simple tools, beginners often trip up. The biggest error is "indicator overload." Adding ten different lines to your chart creates noise, not clarity. A study by CryptoQuant found that traders using more than five simultaneous indicators had significantly lower profitability than those sticking to one or three. Keep it simple.
Another pitfall is ignoring timeframe alignment. You might see a buy signal on a 5-minute chart, but if the weekly chart shows a strong downtrend, that buy signal is likely a trap. Always check the higher timeframe first. Establish the trend on the weekly or daily chart, then look at lower timeframes for precise entry points. This multi-timeframe approach filters out false signals and aligns your trades with the bigger picture.

How to Start Your Technical Analysis Journey
Ready to try it? Here is a practical roadmap to get started without spending months studying theory.
- Pick a Platform: Use TradingView or your exchange's built-in charting tool. No paid subscription is needed to start.
- Learn Candlesticks: Spend two weeks just looking at candlestick patterns. Learn what a doji, hammer, or engulfing pattern looks like. These are the building blocks of price action.
- Practice on Paper: Don't risk real money yet. Track hypothetical trades on a notebook. Did your RSI signal work? Did the support level hold? Record your results.
- Backtest Your Strategy: Look at past charts. If you believe a Golden Cross works, scroll back through history and see how often it actually led to profits versus losses.
- Start Small: When you feel confident, trade with small amounts. Focus on executing your plan, not making huge profits. Discipline is more important than prediction accuracy.
Expect a learning curve of 3 to 6 months before you feel comfortable. During this time, focus on consistency rather than complexity. Master one indicator deeply before adding another. For example, become an expert at reading RSI divergences before trying to combine it with MACD.
The Future of Crypto Charting
Technical analysis isn't standing still. As more institutional money enters the crypto space, traditional patterns are becoming more reliable. The SEC's approval of spot Bitcoin ETFs has reduced erratic retail-driven spikes, making standard technical signals more predictable. Additionally, new tools are emerging that combine on-chain data with traditional charts. You can now overlay metrics like Net Unrealized Profit/Loss directly onto your price chart, giving you a clearer view of holder sentiment alongside price action.
AI is also entering the scene. Some platforms now use machine learning to automatically detect patterns like head-and-shoulders or cup-and-handle formations. While these tools are impressive, they shouldn't replace your judgment. AI can flag a pattern, but you still need to assess the context, volume, and overall market mood. The future lies in hybrid approaches where technical signals are confirmed by on-chain data and macroeconomic conditions.
Ultimately, technical analysis is a skill, not a magic wand. It provides probabilities, not certainties. By combining disciplined chart reading with sound risk management, you can navigate the volatile crypto markets with more confidence and less guesswork.
Do I need expensive software for technical analysis?
No. Most major exchanges like Binance, Coinbase, and Kraken offer free charting tools with basic indicators like Moving Averages and RSI. Platforms like TradingView have a robust free tier that is sufficient for most individual traders. Paid plans offer more features, but they are not required to start.
Is technical analysis better than fundamental analysis?
Neither is inherently better; they serve different purposes. Technical analysis is superior for timing entries and exits in the short term. Fundamental analysis is better for selecting high-quality projects for long-term holding. The most effective strategy often combines both: use fundamentals to choose the asset and technicals to time the trade.
How long does it take to learn technical analysis?
Basic proficiency typically takes 3 to 6 months of dedicated study and practice. The first month should focus on understanding candlesticks and support/resistance. Subsequent months involve mastering specific indicators and backtesting strategies. Consistency is key; daily practice yields faster results than sporadic deep dives.
What is the most reliable technical indicator for crypto?
There is no single "most reliable" indicator. Reliability comes from confluence, meaning multiple indicators agreeing. However, Moving Averages (specifically the 50-day and 200-day) and RSI are widely considered the most foundational and consistently useful tools across different market conditions. Volume analysis is also critical for confirming the strength of a move.
Can technical analysis predict exact price targets?
Not exactly. Technical analysis provides probability zones rather than exact numbers. It helps identify potential support levels where price might stop falling or resistance levels where it might stall. Traders use these zones to set stop-losses and take-profit orders, accepting that the market may overshoot or undershoot these targets due to volatility.






nic c
August 26, 2026 AT 09:26Oh, look at us, playing with our shiny new toys again. The article breathes down your neck telling you that technical analysis is just a fancy way of saying "gambling with extra steps," yet here we are, treating candlesticks like sacred relics. It's almost poetic how the market ignores all these pretty lines when it feels like dropping 30% in an afternoon, isn't it? You see, the real magic isn't in the RSI or the Bollinger Bands; it's in the sheer, unadulterated chaos of human greed and fear, which no chart can ever truly capture. So go ahead, draw your little boxes on the screen, but don't be surprised when the algorithmic whales eat your lunch while you're busy counting pixels.
Alan Hawkins
August 27, 2026 AT 14:25I actually agree with the point about not overloading indicators. I spent my first month trying to use MACD, RSI, Stochastics, and Volume all at once and ended up paralyzed. Once I stripped it back to just price action and support/resistance, my confidence went up significantly. It’s less about predicting the future and more about managing risk, which this post does a good job highlighting.
Kevin Payette
August 28, 2026 AT 19:33You think you've got it figured out because you stopped using five tools? Pathetic. Real traders understand that confluence is the only thing that matters. Without multiple signals aligning, you're just guessing in the dark. The market doesn't care about your 'confidence.' It cares about liquidity. And right now, liquidity is thin. Watch your back.
Rebecca Springer
August 29, 2026 AT 18:25To be fair, for beginners, simplicity is key. If you add too many layers, you lose sight of the basic trend. I find that sticking to one or two reliable methods helps build discipline before you start getting fancy with overlays. It’s a lot like learning to walk before you try to run a marathon.
Martha Packard
August 29, 2026 AT 19:16Let's be honest, technical analysis is just astrology for people who hate being called superstitious. You draw lines on a chart and pretend they have meaning, then act shocked when the line breaks. It's all confirmation bias dressed up in a suit and tie. The only constant in crypto is volatility, and no amount of 'support' will stop a rug pull or a regulatory hammer.
Jarnail Singh
August 31, 2026 AT 12:08Hmm, interesting perspective :D But if you look at the history of Indian markets and even global equities, patterns do repeat because human psychology remains constant. Whether it's Bitcoin or Nifty 50, fear and greed drive the boat. The article misses the cultural aspect of how different regions react to volatility, but otherwise, solid points on the basics. We Indians are very disciplined with our savings, so maybe we should apply that same discipline to trading rather than just chasing pumps :)
Steve Sulley
September 1, 2026 AT 10:16its all bs anyway. i tried ta for a year and lost money. then i started hodling and made money. the charts are just noise. stop looking at the screens and just buy and hold. its simpler that way. also the rsi is useless in strong trends. dont trust any indicator.
David Powell
September 2, 2026 AT 07:59How quaint. You've discovered 'buy and hold' after a year of losing money to the market maker. Most people who say TA is 'BS' are simply admitting they lack the discipline to execute a strategy. It's easier to blame the tool than the user. But sure, keep telling yourself it's all noise. It makes the pain of missed opportunities slightly less sharp.
J Shepherd
September 2, 2026 AT 11:02Good shout on the multi-timeframe alignment. A lot of newbies get caught by bear traps on the 15-min chart because they aren't checking the daily structure. If the higher timeframe is pointing down, those lower timeframe bounces are usually just dead cat bounces. Always respect the dominant trend vector. It saves you from getting chopped up in range-bound markets where the indicators give conflicting signals.
Jane yuan
September 2, 2026 AT 11:08The assumption that price reflects all known information is the weakest link in this entire theory. In crypto, news often lags behind price action due to insider trading and whale manipulation. By the time the 'news' hits the mainstream, the move is already done. Technical analysis works best in efficient markets, but crypto is still far from efficient. We are still in the wild west of data transparency.
Sam Ariafar
September 3, 2026 AT 03:09It is important to remember that while these tools help, they do not guarantee success. Many people fall into the trap of thinking that if they just find the perfect indicator combination, they will never lose again. That is a dangerous mindset. The market is always changing, and what worked last month may not work next month. Humility is the most important trait a trader can have. Respect the risk, manage your position sizes, and accept that losses are part of the game. Do not let your ego dictate your trades, or you will end up paying a heavy price for your arrogance.